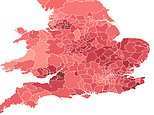
Rental prices have rocketed 50 per cent in parts of the country in a decade, shock analysis shows.
For the 10th year in a row, Kensington and Chelsea remains the priciest borough for renters. Average fees hit £3,640 in March.
Since March 2015 this has risen by £966, or 36 per cent, according to the Office for National Statistics (ONS).
This was the biggest increase in terms of raw fees, although the largest percentage jumps were recorded outside of London.
Salford, in Manchester, saw average rental bills explode from £641 to £1,109 – a 73 per cent leap.
Similarly high rises were observed in Lothian in Scotland (72.1 per cent to £1,424) and Leicester (71.2 per cent to £983).
Another 112 other authorities also logged a rise above 50 per cent, MailOnline and This is Money analysis shows.
Aberdeen and Shire was the only one of 336 geographical areas of England, Scotland and Wales where prices have actually fallen.
In March, renters living within the county’s boundaries paid £842, on average – down from £969 in the same month in 2015.
As the North Sea oilfields’ premier UK port, the city – considered Europe’s oil capital – has seen wealth and standards fluctuate with the global prices.
In the early 2010s, oil prices soared, meaning confidence and investment in the area was abundant.
But oil price crashes and fluctuations since, as well as a political shift away from fossil fuels and a glut in housing supply, has dampened the market.
The biggest London percentage rise was Barking and Dagenham in 37th, which leapt 58.9 per cent over the period.
The growth in rent prices has far exceeded wages, say campaigners for Generation Rent.
Grappling soaring interest rates, landlords have been forced to pass the extra fees onto tenants.
It means that renters in ‘red-hot’ markets are having to fork out hundreds extra per month, with rents now at a record high.
Spiralling rental bills heap even more pressure on families struggling to get on the housing ladder.
A lack of available rental properties and high demand, partly fuelled by immigration, has helped to push prices higher.
Behind Kensington and Chelsea, Westminster and Camden are the second and third most expensive places to rent (£3,277 and £2,840, respectively).
Soaring London rental prices are driving many adults to re-enter pricey and often small communal living arrangements called ‘co-living’ spaces, often teamed with amenities like gyms and cinemas.
The figures from the ONS come as Labour approach its one year anniversary in the seat of Government.
On the campaign trail in July last year, Sir Keir Starmer made various pledges to reform the private rental market by strengthening tenant rights and holding landlords to account.
The Renters Rights Bill is the first sign of that tide changing.
Making its way through Parliament currently, it includes abolishing fixed-term tenancies and introducing a sector-wide ‘decent homes standard’ for the condition of rented properties to adhere to.
The average cost of a UK home sat at £268,000 – 5.4 per cent higher than a year prior.
Tom Bill, partner at real estate consultancy told MailOnline: ‘What we are starting to see is that rental supply is becoming more constrained and landlords face tougher green regulations and mortgage costs after the Spring Budget.
‘Additionally, the Renters Rights Bill tips balance of power towards the tenant but raises plenty of question marks for landlords as well.
‘After all it’s being brought in by the government to protect tenants but could ultimately push rents a little bit higher.’
Comparing the House Price Index (HPI) to the rental equivalent, the Price Index of Private Rents (PIPR) lays bare this problem.
In the last year, UK monthly private rents increased by 7.7 per cent, to £1,332.
Rent inflation was the highest in the North East and the lowest in Yorkshire and The Humber.
As of February this year, the average price of a home in England rose 4.1 per cent to £207,000 and 5.7 per cent in Wales to £186,000.
On bridging the gap between renting and making the move to buy, Mr Bill said: ‘Affordability in the UK housing market is a problem that people have faced for years
‘We are seeing people increasingly look at more affordable parts of the country in secondary cities and stronger house price growth away from London and the South East as a result.’


